News Story
Big Data for Decision Makers

Artwork: David Plunkert
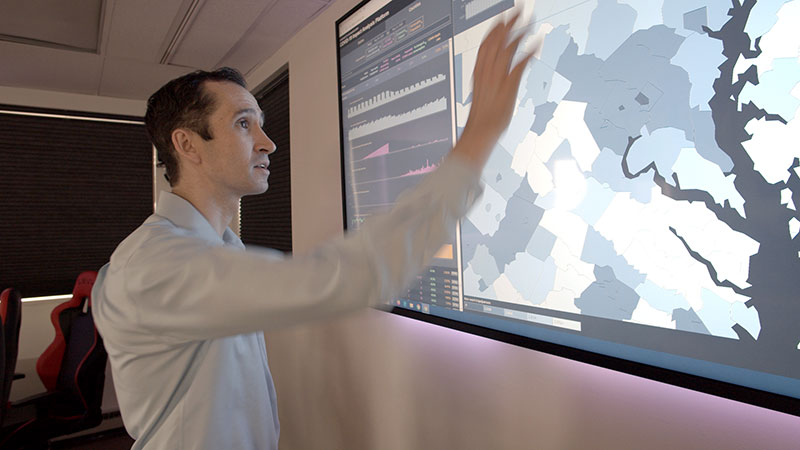
Navigating the right path forward in the face of the COVID-19 pandemic requires an accurate understanding of its impact. Since April 2020, the COVID-19 Impact Analysis Platform has provided decision makers with a clear view of how the current epidemiological situation affects our society, economy, mobility, and public health.
Pioneered by the Clark School’s Maryland Transportation Institute (MTI) and Center for Advanced Transportation Technology (CATT), the tool utilizes color-coded tables and an interactive map that sorts dozens of big-data metrics at national, state, and county levels.
The platform leverages privacy-protected data from mobile devices, government agencies, hospitals, and other sources that are computed and aggregated using validated algorithms. Tracked statistics include the percentage of people staying home, testing capacity, unemployment, COVID-19 death rates, and other data points. Created in collaboration with epidemiologists, public health experts, and economists and powered by the massive data repositories at MTI and CATT, the platform provides insight into the management of COVID-19, helping both the general public and policymakers make informed decisions.
The list of regular dashboard users includes multiple federal, state, and county agencies:
- Center for Disease Control and Prevention (CDC)
- U.S. Department of Transportation and Bureau of Transportation Statistics
- U.S. Department of Veterans Affairs
- U.S. Department of the Treasury and Federal Reserve System
- Prince Georges’ County, Baltimore County, Baltimore City, Howard County, and other local governments in Maryland
Since its launch, the COVID-19 Impact Analysis Platform has tracked several trends in the societal response to the pandemic.
 In late April, a new catchphrase entered the public’s lexicon: “quarantine fatigue.” Headlining in The New York Times and on CNN, public impatience with stay-at-home orders translated into noticeable growth in mobility. The dashboard tracked alarming trends in social distancing, interstate travel, shopping trips, and more over a two-week period of quarantine fatigue in late April and early May, sounding an early warning for the significant virus surges seen across the country over the summer.
“It was striking to see such a resurgence in travel,” says Lei Zhang, Herbert Rabin Distinguished Professor of civil and environmental engineering and MTI co-director, who led development of the platform. “Tracking these trends can help regions understand the factors shaping this pandemic and prepare for what might be coming down the road.”
Mobility metrics—like the ones used to suggest quarantine fatigue in April—can also track out-of-county and non-work trips, alerting lawmakers of trouble down the road; as one example, after Maryland Governor Larry Hogan announced a partial state reopening in May, the platform showed a flood of visitors to Maryland’s Eastern Shore from the Washington, D.C. metro region, which was still under a stay-at-home order. Economic metrics can indicate trends in consumer consumption and employment, allowing targeted economic response and support. Metrics specific to vulnerable populations can show rates of infection in populated inner cities as well as by race and ethnicity.
“As the leader in mobility analytics, we have the ability to look at broader aspects, such as the social dimension of all this—are people listening to the public messaging, and are they behaving in ways that help or hinder the COVID-19 response?” says CATT Director Michael Pack. “We can quantify the answers to questions like these.”
 The platform also houses the Society and Economy Reopening Assessment (SERA) tool, which provides real-time indicators of a region’s readiness for reopening. As many states were facing pressure to re-open in early May, the tool indicated that not one state met the six public health gating criteria set by the World Health Organization, the Centers for Disease Control and Prevention (CDC), and the White House.
“We are in a unique position to help stakeholders wade through the complex aspects and impacts of COVID-19,” says MTI Assistant Director Sepehr Ghader (M.S. ’15, Ph.D. ’19 civil engineering), who manages the project. “When the pandemic hit, we said to ourselves: ‘We have the data, we have the capability; let’s do something for the community.’”
The platform, says Ghader, was a natural outgrowth of decades-long research in transportation and mobility at UMD. When the pandemic hit, MTI researchers capitalized on existing infrastructure and sophisticated analytics to quickly develop the tool to provide critical, time-sensitive data in a digestible, actionable format.
“‘Big data for public good’ has been an important mission of MTI since its establishment. Connecting our expertise to real-world challenges is what we do, and COVID-19 is like no other challenge we’ve seen in our lifetime,” explains Zhang. “We were determined to marshal these resources in a way that could advance the public good during this time of crisis.”
Published October 20, 2020


